Four views, one dataset
Read the market from every angle without leaving the workspace. Each view answers a different question.
| View | What it shows | Best for |
|---|---|---|
| Top Brands | 30-day and total sales, product count, average price, videos, views, Video GMV, Live GMV, region. | Spotting who's dominating your category and reverse-engineering their playbook. |
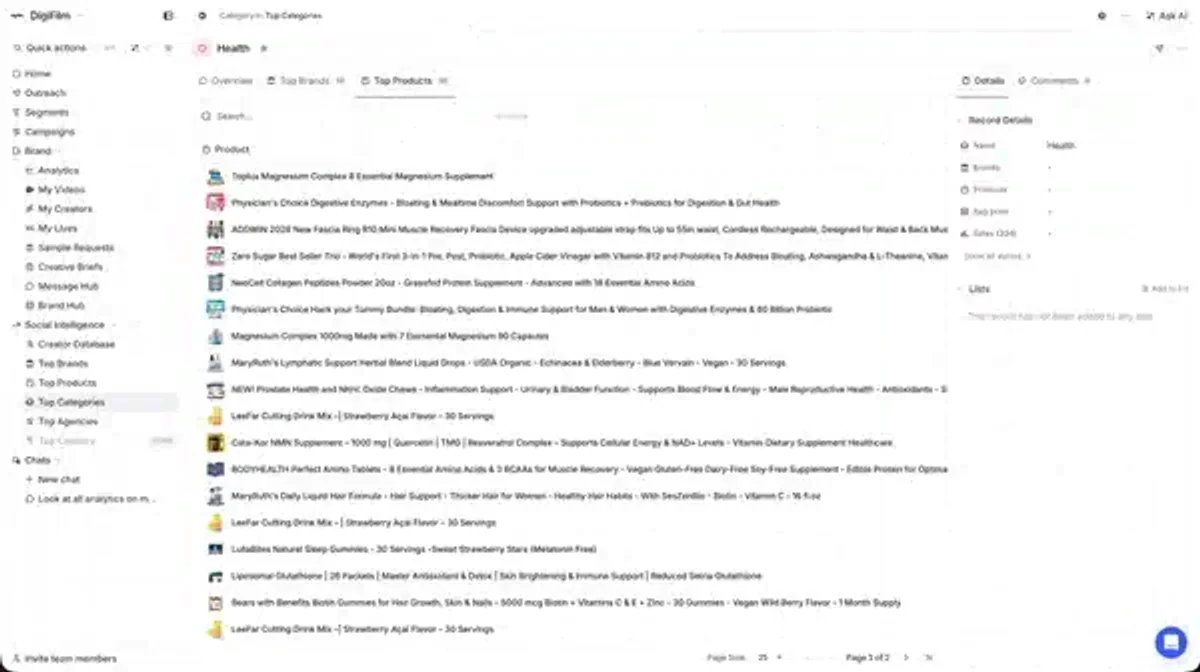
| Top Products | Best-selling products with 30-day and total sales, units sold, price, video and live GMV split. | Finding winning SKUs before they saturate, briefing creators with proven references. |
| Top Categories | Category-level sales trends, growth, and saturation signals over time. | Understanding where demand is heading before you commit inventory or content. |
| Top Agencies | Leading TikTok Shop agencies ranked by the brands and GMV they drive. | Benchmarking agency partners or sizing up the competition running creator programs at scale. |
Talk to us
Want to see Social Intelligence on your category?
We'll pull live data for your niche on a walkthrough and show you the brands, products, and creators worth watching. No deck.
What you actually get
- Real TikTok Shop sales data. Not estimates. Live numbers from the platform.
- Filter and sort by any column. Region, price tier, niche, video vs live split.
- Drill-down on top performers. Click a brand or product to see the videos and creators behind it.
- Track over time. See 30-day movement to spot rising brands, products, and categories.
- Feeds your own program. Use intelligence to seed creator outreach, content briefs, and SKU decisions.
How to get started
- Open Top Categories and filter to your niche to size the market.
- Open Top Brands within the niche to see who's leading and at what price point.
- Open Top Products to find SKUs that are growing but not yet saturated.
- Click into the top videos behind those products to study hooks and creators.
- Pull those creators into a Creator List and launch an outreach sequence.
