Who this is for
- Brand owners answering "which creator drove the most GMV this month?"
- Marketing teams reporting weekly performance to the founder.
- Agencies pulling client-ready creator performance summaries.
- Ops teams identifying top performers to promote into VIP lists.
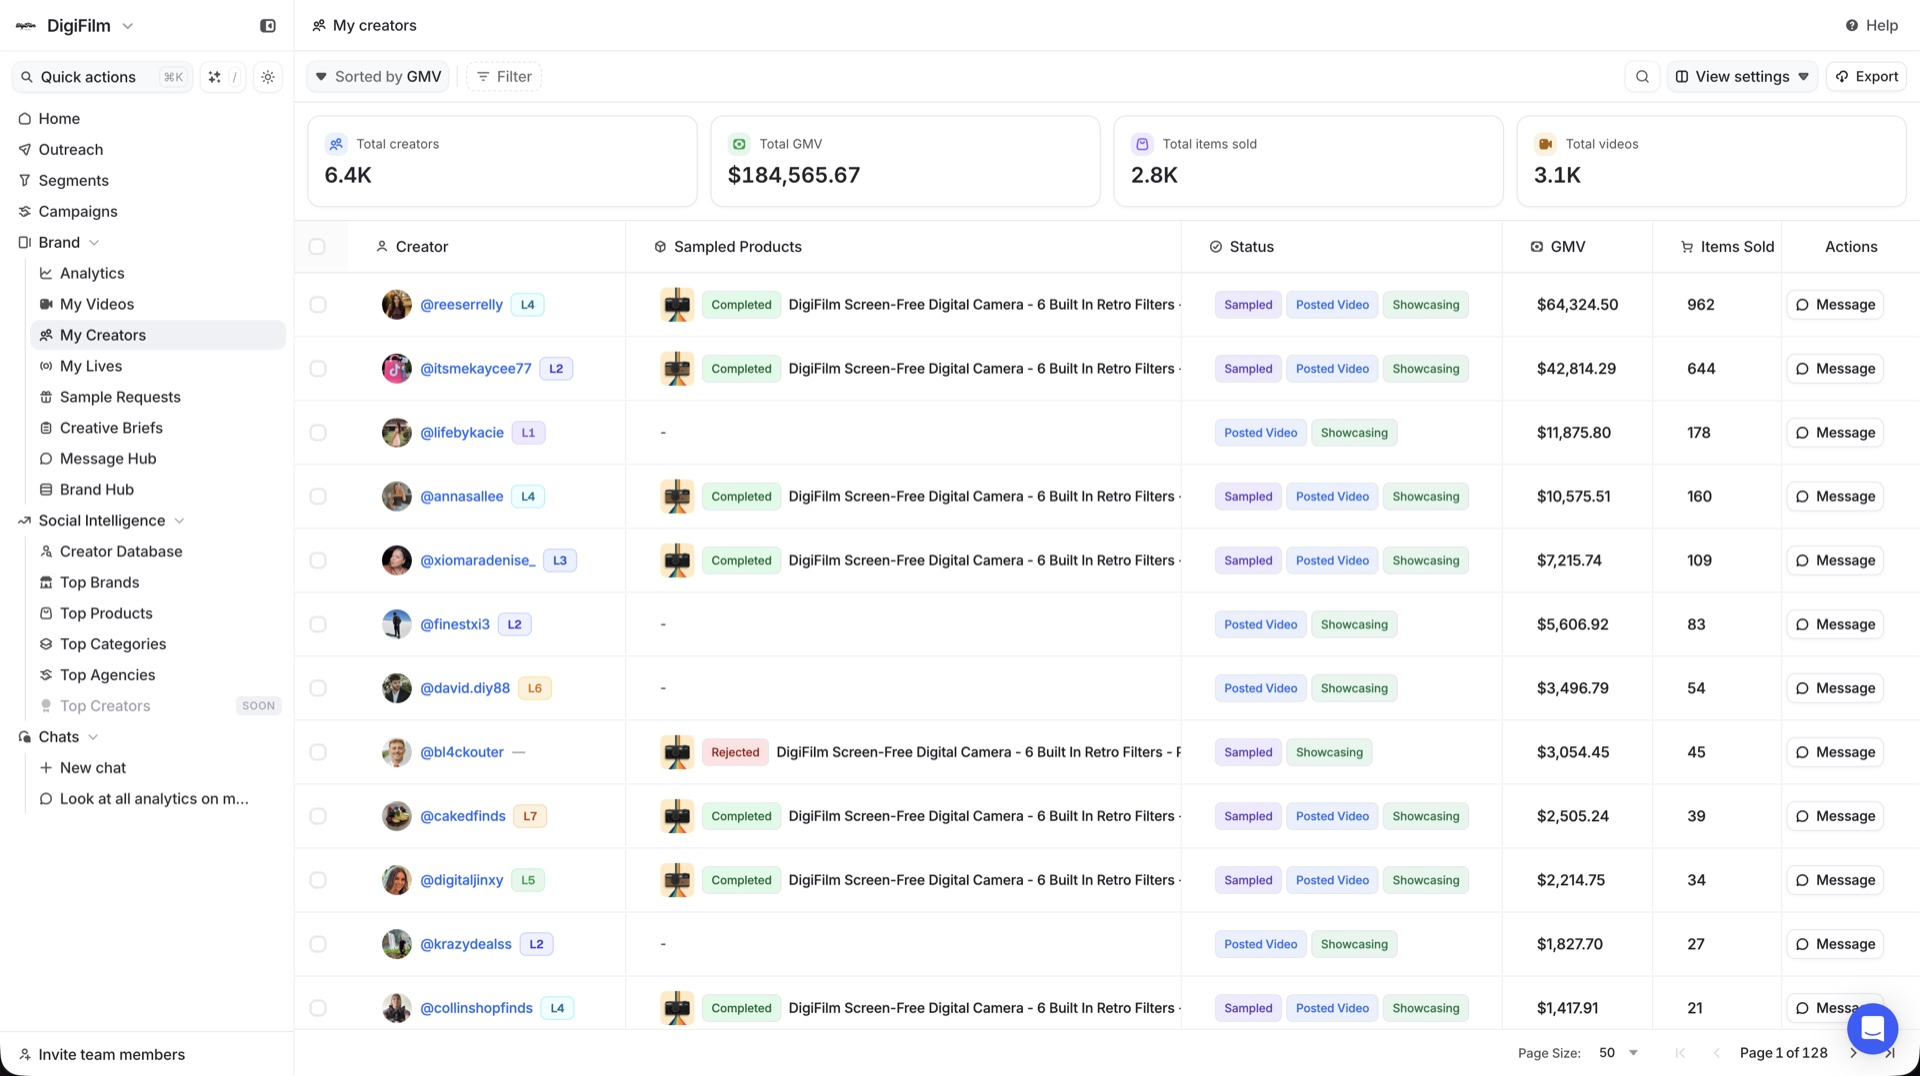
What Creator Analytics shows
The core view is a sortable, filterable table of every affiliate in your program with the metrics that matter.
| Metric | What it means |
|---|---|
| GMV | Total revenue driven by this creator through your TikTok Shop affiliate program. |
| Posts | Number of videos and lives the creator made featuring your products. |
| Engagement | Aggregate views, likes, comments across the creator's program content. |
| ROI | GMV relative to sample cost and commission paid for that creator. |
Talk to us
Want to see your top creators ranked by GMV?
Walk through Creator Analytics on live data, identify your top 10%, and decide where to invest next. No deck.
What you actually get
- Live per-affiliate data. Updates continuously as your TikTok Shop processes orders.
- Sortable + filterable. By date range, Creator List, niche, ROI, or any column.
- Roll-ups across lists. Compare performance between VIPs, follow-ups, and prospects.
- Export-ready. Clean CSV exports for client and investor reporting.
- Feeds the rest of the workspace. Top performers surface for VIP lists; silent creators surface for re-engagement.
How to get started
- Connect your TikTok Shop. Creator Analytics begins pulling live data immediately.
- Open the dashboard and sort by GMV over the last 30 days.
- Tag the top 10% as VIPs and move them into a dedicated Creator List.
- Filter for silent creators (samples shipped, zero posts) and push them into a re-engagement Segment.
- Save your weekly view as a default filter for fast Monday-morning reporting.
