Fee and profit calculator

Amazon FBA Calculator.

Calculate your Amazon FBA fees, per-unit profitability, and margins. Includes referral fees, fulfillment fees, and storage costs with seasonal breakdown.

Free Amazon FBA calculator for sellers

Most Amazon sellers find out their unit economics are broken after they ship. This Amazon FBA calculator runs the full fee stack before you commit to inventory: referral fees by category, fulfillment fees by size tier, monthly storage with peak-season surcharges, and your landed COGS. You get a clean per-unit profit number you can take to your supplier and your finance team without crossing your fingers.

  • FBA fee calculator covering Amazon's current 2026 fulfillment, referral, and storage rate cards
  • Acts as an Amazon profit calculator on every SKU, factoring ad spend, returns, and average order value
  • Side-by-side seasonal breakdown for Jan-Sep vs Oct-Dec storage so peak inventory does not blindside your margin
  • Built for Amazon sellers, FBA aggregators, brand owners, and ecommerce managers planning new product launches

Product specs

Selling Price
?
Your product's listing price on Amazon
$
Length
?
Product length in inches
in
Width
?
Product width in inches
in
Height
?
Product height in inches
in
Weight
?
Product weight in pounds
lb
Billable Weight
?
Greater of actual or dimensional weight (L×W×H / 139)
2.30 lb
Size Tier
?
Amazon size tier based on dimensions and weight
Large Standard-Size

Amazon fees

Referral Fee Category
?
Amazon charges a referral fee percentage based on product category
Custom Referral %
?
Override the category rate with your own percentage
%
Referral Fee
?
15% of selling price
$4.50
FBA Fulfillment Fee
?
Amazon's pick, pack, and ship fee based on size tier and weight
$6.10
Storage Duration
?
How many months the product sits in Amazon's warehouse
mo
Storage (Jan to Sep)
?
$0.87/cu ft/mo × 0.185 cu ft
$0.32
Storage (Oct to Dec)
?
$2.4/cu ft/mo × 0.185 cu ft
$0.89

Product costs

Unit Cost
?
Manufacturing or wholesale cost per unit
$
Shipping to FBA
?
Inbound shipping cost per unit to Amazon warehouse
$
Prep / Labeling
?
Per-unit prep service or labeling cost
$

Additional costs

Advertising Cost
?
Estimated PPC / advertising spend per unit
$
Other Costs
?
Any additional per-unit costs (insurance, samples, etc.)
$
Return Rate
?
Share of orders returned. A returned unit still costs you the product, inbound shipping, prep, and the fulfillment fee.
%
Target Margin
?
The net margin you want to hit. Drives the target price and ad headroom solvers.
%

Results

Net profit per unit?Selling price minus every Amazon fee, your landed product cost, prep, and ad spend. Uses Jan to Sep storage rates.$7.72$7.15 in Oct to Dec
Net margin?Net profit as a share of the selling price. Most FBA sellers aim for 15 to 25 percent after ad spend.25.7%23.8% in Oct to Dec
Return on cash?Net profit divided by the cash you put into each unit: product cost, inbound shipping, and prep.83%Profit per dollar of inventory
Break-even price?The lowest price that still covers every cost. Below this you lose money on each unit sold.$20.91Zero profit, zero loss
Price for 20% margin?Solves for the price that hits your margin target, accounting for the referral fee scaling with price.$27.34Current price already clears it
Amazon's take?Every fee Amazon charges as a share of your selling price: referral, fulfillment, closing, and storage.36.4%$10.92 per unit

Profit waterfall

Selling price$29.99Referral fee (15%)-$4.50Fulfillment fee-$6.10Storage-$0.32Inbound shipping-$1.00Product cost-$8.00Prep-$0.35Advertising-$2.00Net profit$7.72

Amazon fees

Referral fee (15% of price)$4.50
Fulfillment fee (Large Standard-Size)$6.10
Storage, 2 mo (Jan to Sep)$0.32
Storage, 2 mo (Oct to Dec)$0.89
Total Amazon fees$10.92

Your costs

Product cost$8.00
Inbound shipping to Amazon$1.00
Prep and labeling$0.35
Advertising$2.00
Total your costs$11.35
Rules applied
  • Size tier resolved to Large Standard-Size from 10 x 8 x 4 in at 1 lb.
  • Billable weight 2.30 lb, the greater of actual weight and dimensional weight (L x W x H / 139).
  • Referral fee 15% for Home & Kitchen.
  • Storage priced per cubic foot at $0.87 for Jan to Sep and $2.40 for Oct to Dec, on 0.185 cu ft.
  • Break-even and target price solve for the referral fee scaling with price, not a flat deduction.
Profit after 3% returns?A returned unit still costs you the product, inbound shipping, prep, and the fulfillment fee. This blends that loss across every unit sold.$7.2624.2% blended margin
Ad headroom per unit?The most you can spend on advertising per unit and still hit your margin target at the current price.$3.72Max spend at 20% margin

Estimates use published Amazon rate cards for a standard US marketplace listing. Your account may see different fulfillment, storage, or low-inventory charges, so confirm against Seller Central before you commit to a price.

How this calculator works

1. Enter the product, not just the price

Amazon prices fulfillment off size and weight, so the dimensions matter as much as the price. Enter length, width, height, and unit weight, and the calculator resolves your size tier and the billable weight before it touches any fee. Pick the referral category that matches your listing, or type a custom rate if you have a negotiated one.

2. Billable weight is the greater of two numbers

Amazon charges on actual weight or dimensional weight, whichever is higher. Dimensional weight is length times width times height, divided by 139. A light but bulky product gets billed on volume, which is why a pillow can cost more to ship than a dumbbell.

3. The referral fee scales with price

Referral fees are a percentage of the selling price, not a flat charge. That single fact breaks most back-of-napkin math: raising your price to cover a shortfall also raises the fee, so you never close the gap one-for-one. The break-even and target-price solvers below account for this, which is why they return a higher number than a simple cost total.

4. Storage is seasonal and it is not small

Monthly storage runs at one rate from January through September and jumps for October through December. Slow-moving inventory sitting through peak season can quietly erase a point or two of margin. Set the months you expect to hold stock and compare the two columns before you commit to a Q4 buy.

5. Returns cost more than the refund

When a unit comes back, the sale reverses but your spend does not. You have already paid for the product, the inbound shipping, the prep, and the fulfillment fee. Set a realistic return rate and the blended profit figure spreads that loss across every unit you sell, which is the number your P&L actually sees.

6. Solve for the price instead of guessing at it

Break-even tells you the floor. Target price tells you what to charge to hit the margin you want. Ad headroom tells you the most you can spend per unit and still land on that target. Between the three, you can price a product and set an ACOS ceiling without running the same spreadsheet six times.

7. What this does not include

This models a single unit on a standard US listing using published rate cards. It does not include long-term storage surcharges, low-inventory-level fees, aged inventory penalties, removal orders, refund administration charges, or your fixed overhead. Treat the output as a clean per-unit baseline and layer your own account-specific costs on top.

8. Where creator-driven demand changes the math

Paid placement is not the only way to move units. Brands running TikTok Shop creator programs regularly see Amazon sales lift alongside their TikTok GMV, because buyers discover the product on one platform and buy it on the one they already trust. That demand arrives without a per-click cost attached, so the ad line in this calculator drops and the ad headroom you just solved for becomes margin instead of spend.
Features

Everything the FBA calculator does.

Built to model the full Amazon cost stack on a single SKU, so the profit number you see is the profit number you get.

1

Complete fee breakdown. Calculate every Amazon FBA fee, referral, fulfillment, and seasonal storage, in one place.

2

Profit estimation. Enter product costs, selling price, and shipping to see your true per-unit profit instantly.

3

FBA vs FBM comparison. Toggle between fulfillment methods to see which one protects your margin on each product.

4

Seasonal analysis. View margins for both peak season (Q4) and the rest of the year so you can plan inventory.

5

Shareable calculations. Generate a link to save a scenario or share it with your team and suppliers.
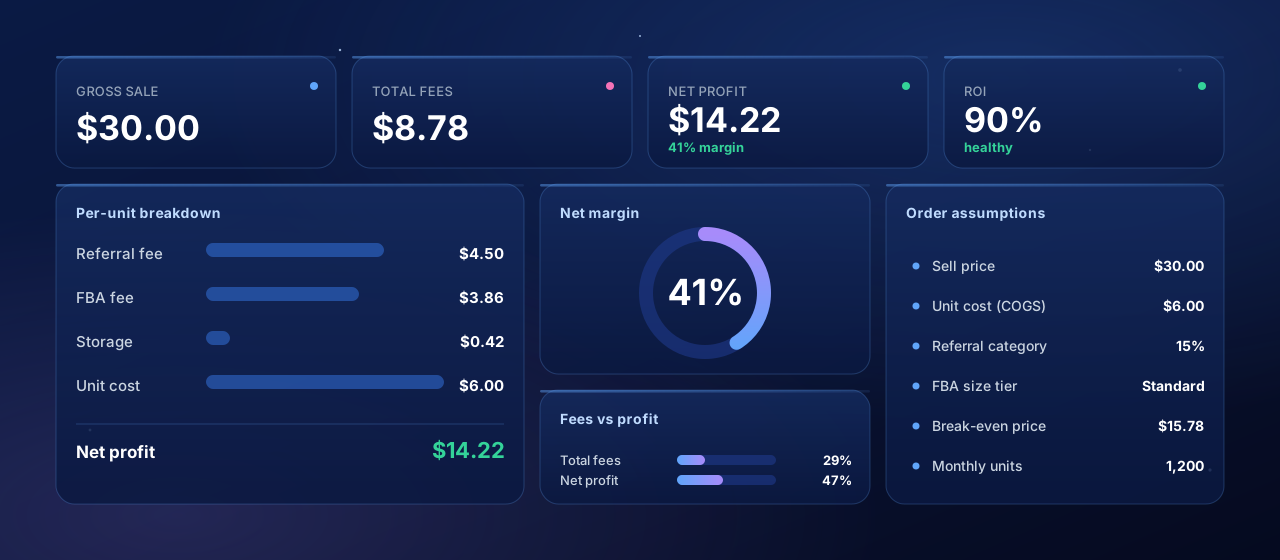
Amazon FBA fee breakdown dashboard showing referral, fulfillment, and storage fees against a 41 percent net margin
A clean per-unit breakdown of every Amazon fee against your landed cost.
How it works

Run a product in four steps.

Enter your numbers once and the calculator does the size-tier math, the fee lookups, and the seasonal split for you.

1

Enter product details.

Input your selling price, dimensions, and weight. The calculator sets your Amazon size tier and billable weight automatically.

2

Add your costs.

Enter unit cost, inbound shipping, prep, advertising, and any other per-unit expense you want to factor in.

3

Select your category.

Pick your product category for an accurate referral fee, or enter a custom percentage if you know your exact rate.

4

Analyze your results.

Review total fees, total cost, net profit, and margin for both seasons. Adjust any input to see the effect live.
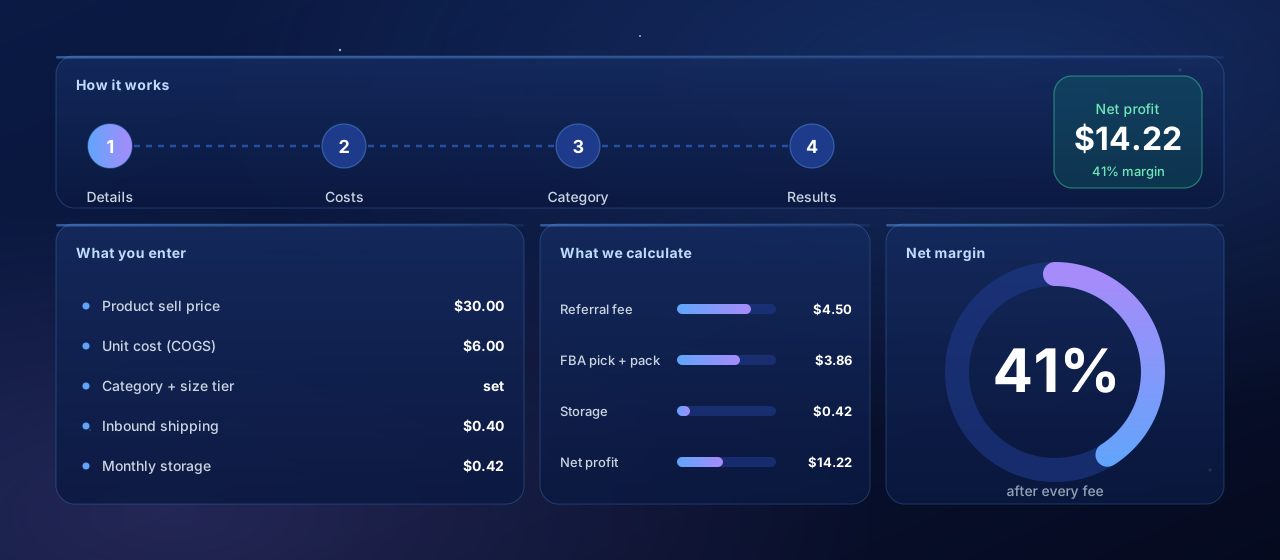
Four-step flow from product details to costs to category to a net profit result of 14 dollars 22 cents
Product specs and costs in, a per-season profit number out.
Talk to us

Want help turning these margins into GMV?

We help Amazon and TikTok Shop brands price right, recruit creators, and scale what sells. 30 minutes, no pitch deck.

Why it matters

Know your real cost before you source.

Most Amazon margin problems are baked in before the first unit ships. Modeling the fee stack up front is the cheapest insurance you can buy.

Maximize your profit. Seeing your true profit per unit lets you price with margin in mind instead of guessing.

Control your costs. A line-by-line breakdown surfaces the fees quietly eating your margin so you can act on them.

Price competitively. Understand how fees move your break-even so you can stay competitive without selling at a loss.

Plan your finances. Get a clear read on earnings and expenses for better budgeting and cash-flow forecasting.

Avoid surprises. A full fee breakdown before you commit to inventory means no nasty settlement-day shocks.
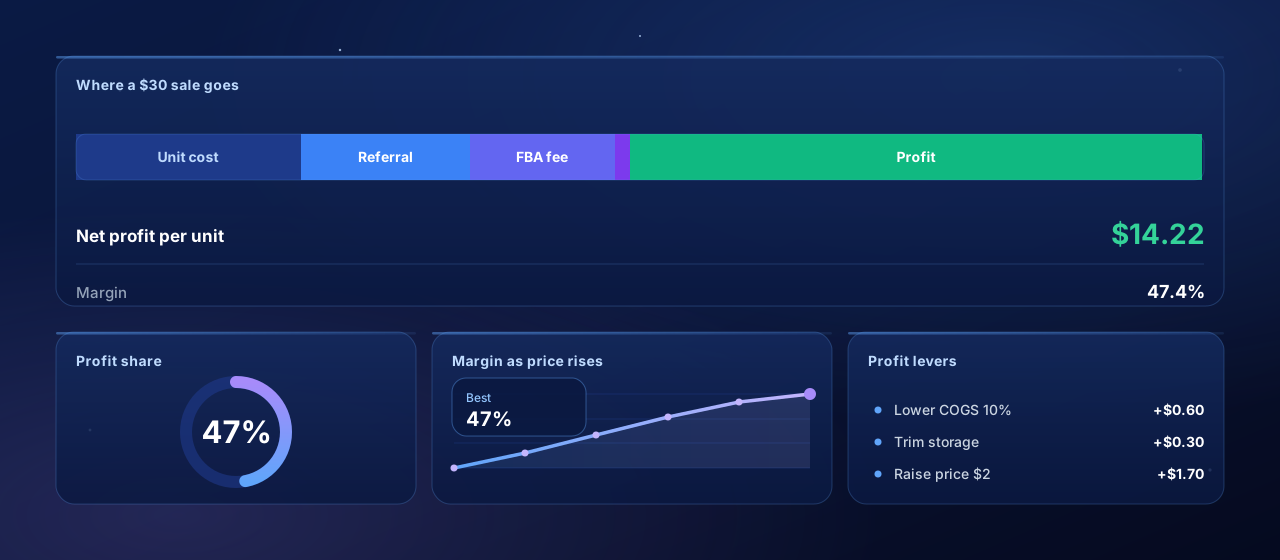
Stacked bar showing where each dollar of a 30 dollar Amazon sale goes across unit cost, referral, FBA fee, storage, and profit
Where every dollar of a $30 sale goes, before and after the fee stack.
Make it pay

Use the calculator to grow margin.

The calculator is a planning tool, not just a fee lookup. A few habits turn it into a real lever on your bottom line.

1

Optimize your pricing. Test price points to find the level that maximizes margin while staying competitive.

2

Select better products. Compare profit across items to spot the most profitable SKUs before you source them.

3

Reduce costs. Model different shipping and fulfillment options to trim expenses and lift your bottom line.

4

Manage inventory smarter. Use seasonal projections to make informed decisions about Q4 stocking levels.

5

Plan promotions. See how discounts and ad spend hit profitability before you run a campaign.
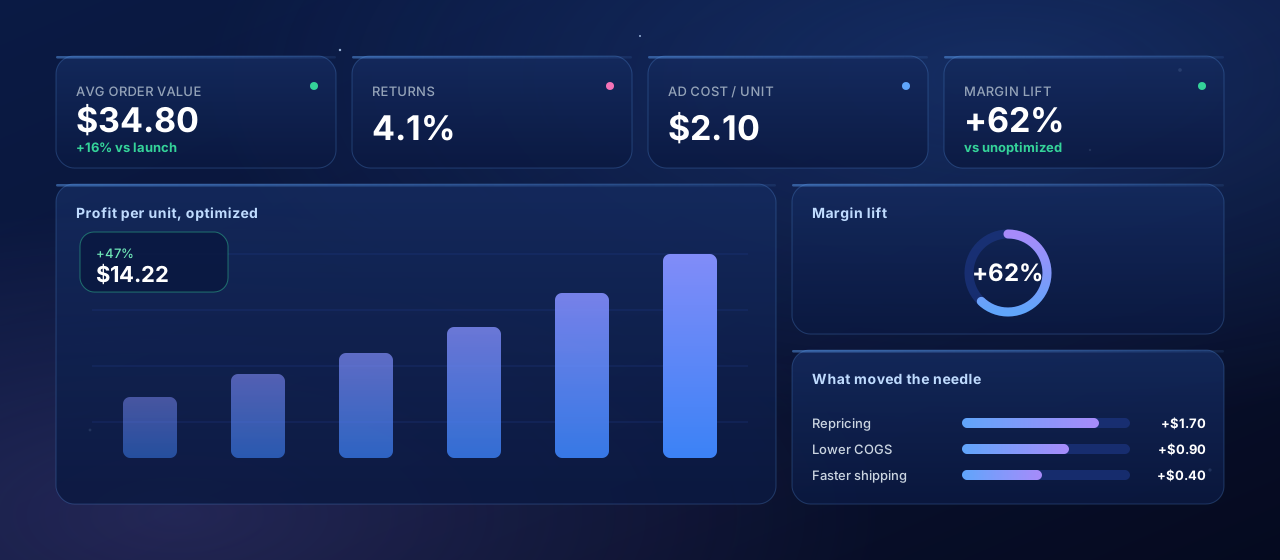
Rising bar chart with an upward trend line showing profit per unit growing 47 percent after optimization
Small pricing and sourcing changes compound into real margin gains.
Who it's for

Built for every kind of Amazon seller.

Whether you are validating your first product or scaling an established catalog, the calculator helps you make profitable decisions.

New Amazon sellers

Validate product ideas and understand the true cost of selling before you invest.

Private label brands

Set optimal pricing and margin targets when launching new products on Amazon.

Wholesale sellers

Quickly assess if a wholesale deal is profitable after all FBA costs and fees.

Retail arbitrage sellers

Calculate margins on the spot when sourcing products to flip on Amazon.

Frequently asked questions

Questions, answered.

An FBA Calculator is a tool used by Amazon sellers to calculate all fees associated with the Fulfillment by Amazon program. It helps you understand your true costs and profit margins so you can make informed pricing and sourcing decisions.
Our calculator uses Amazon's current FBA fee schedule including size tier classifications, weight-based fees, and category-specific referral rates. We regularly update the calculator when Amazon announces fee changes.
Amazon charges significantly higher storage fees from October through December (Q4) due to increased warehouse demand during the holiday season. Storage rates are approximately 3x higher during this peak period.
Amazon charges based on whichever is greater: actual weight or dimensional weight (Length x Width x Height / 139). This means lightweight but bulky items may cost more to fulfill than their actual weight suggests.
FBA is ideal for high-volume sellers who want Prime eligibility and hands-off fulfillment. FBM (Fulfilled by Merchant) makes sense if you have low-cost shipping options, want more control, or sell slow-moving inventory where storage fees would eat margins.
Yes, our FBA Calculator is completely free to use. Simply enter your product details and costs to get instant profit calculations with no signup required to access the basic features.

This calculator is provided for informational purposes only. Results are estimates based on publicly available fee structures and may not reflect your actual costs. Always verify current rates with the platform before making business decisions.

Get started with us

Automate your creator campaigns.

From outreach to GMV reporting, Hubfluence runs every part of your creator campaigns for agencies and enterprise brands. Set it up once, scale it across every brand you manage.

Creator Discovery iconCreator Discovery
Campaign Management iconCampaign Management
Social Intelligence iconSocial Intelligence
Reporting & Analytics iconReporting & Analytics